UPLOAD FILE

Drag & drop or click to select

.csv  .tsv  .txt  .xls
File formats supported:
.csv  .tsv  .txt  .xls

SELECT DATA
Compound
Hold Ctrl / ⌘ to select multiple
Activity threshold
0
nM

Visualization

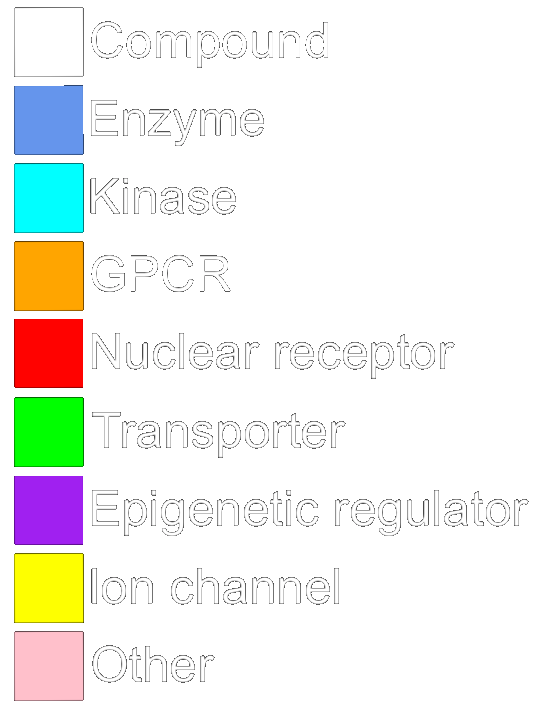
Network node color legend:
CUSTOMIZE GRAPH
Node Labels and Size

Node size
Central
Peripheral
XLLMSXS

Node shape
Central
Peripheral
CircleDiamondSquare


USER GUIDE
Workflow

The network visualization consists of two mandatory and one optional steps.

Step 1 — Data upload (mandatory)

Upload a bioactivity file (.csv, .tsv, .txt or .xls) with the following six columns:
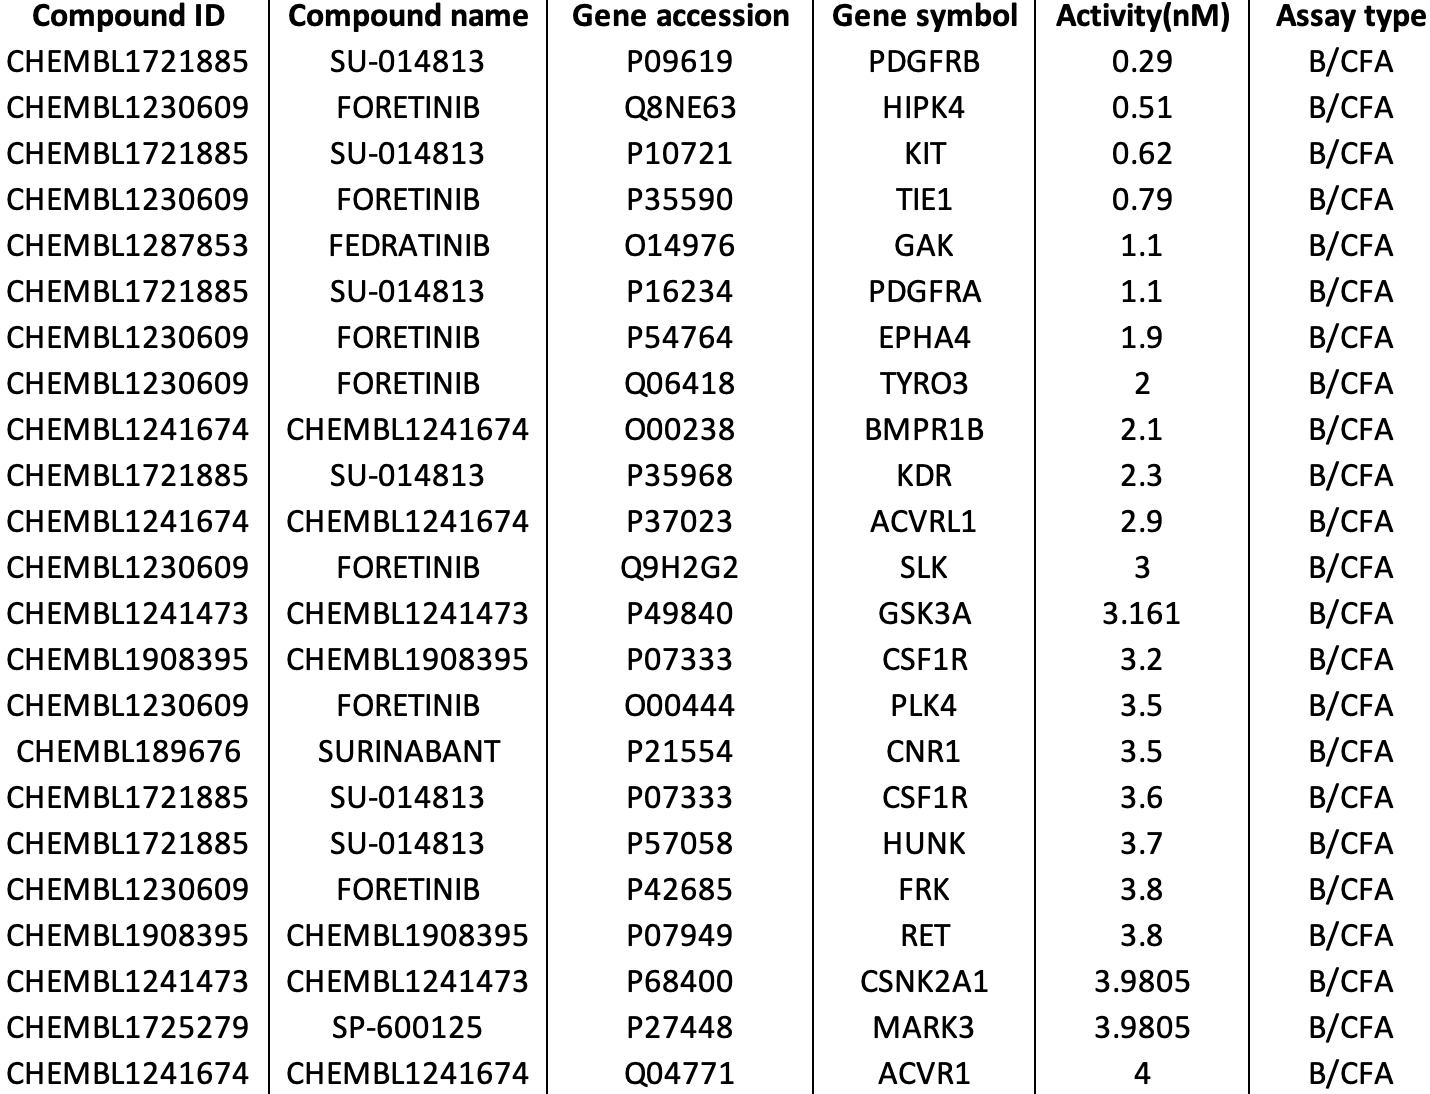
  • Compound ID: Compound ChEMBL ID
  • Compound name: Compound name, if any, otherwise the ChEMBL ID
  • Gene accession: Gene accession number of protein target (UniProt ID)
  • Gene symbol: Gene symbol of protein target
  • Activity: Activity measured in nM
  • Assay type: Whether the assay is biochemical or cell free assay (B/CFA) or other (Other)

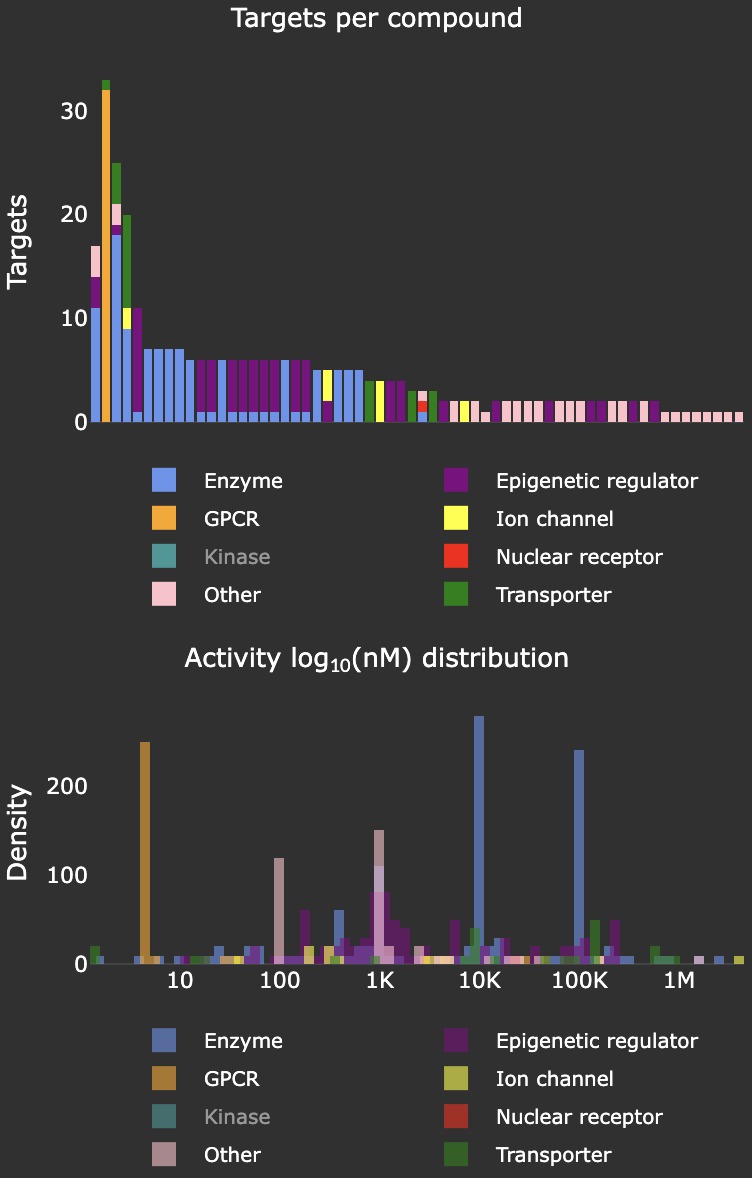
Data overview: targets per class + activity distribution.
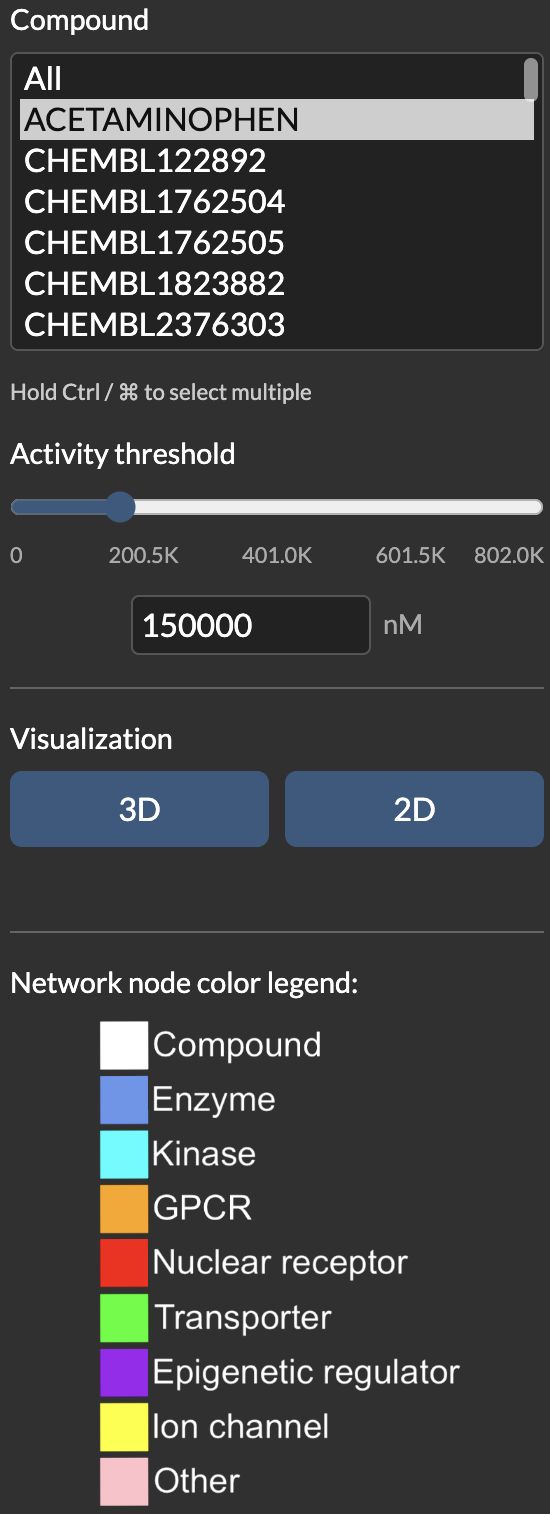
Step 2 — Data selection (mandatory)

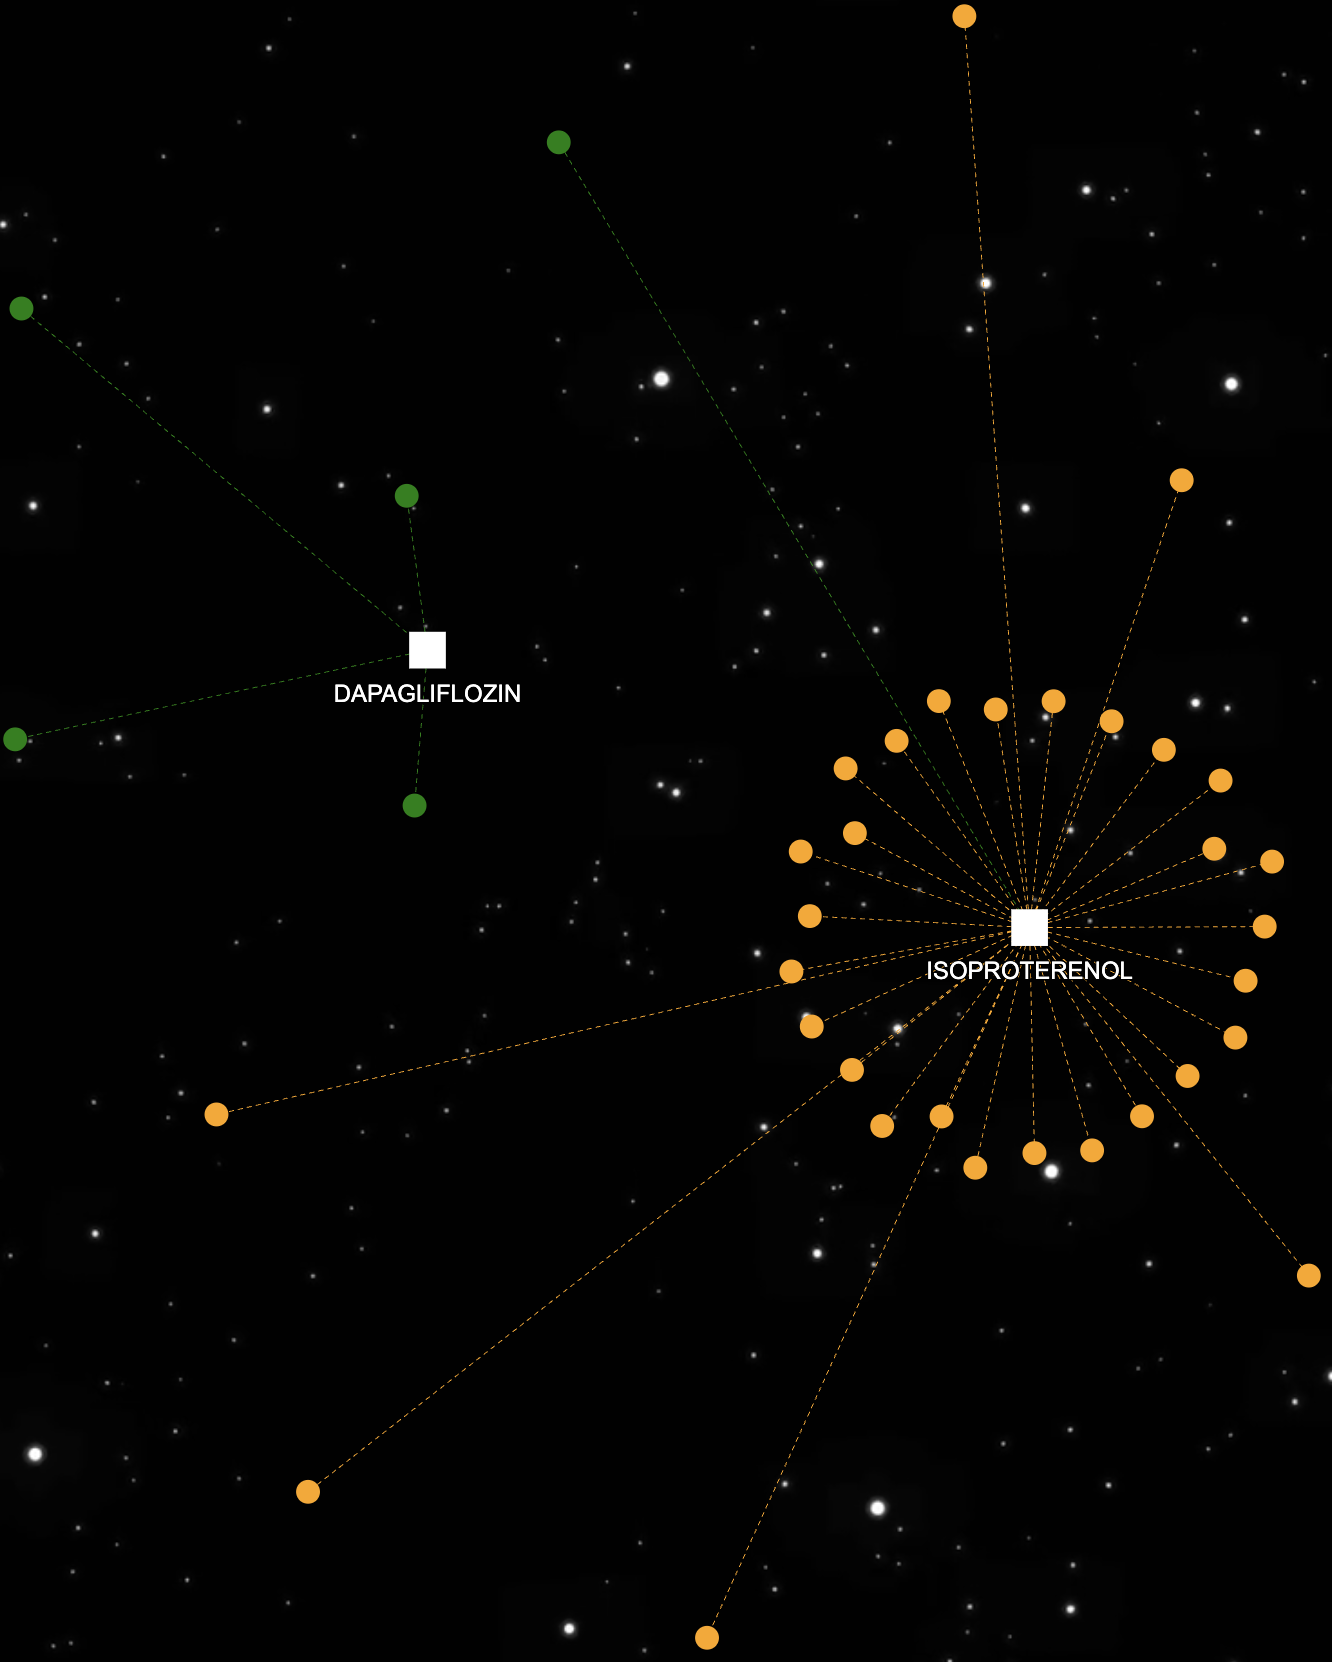
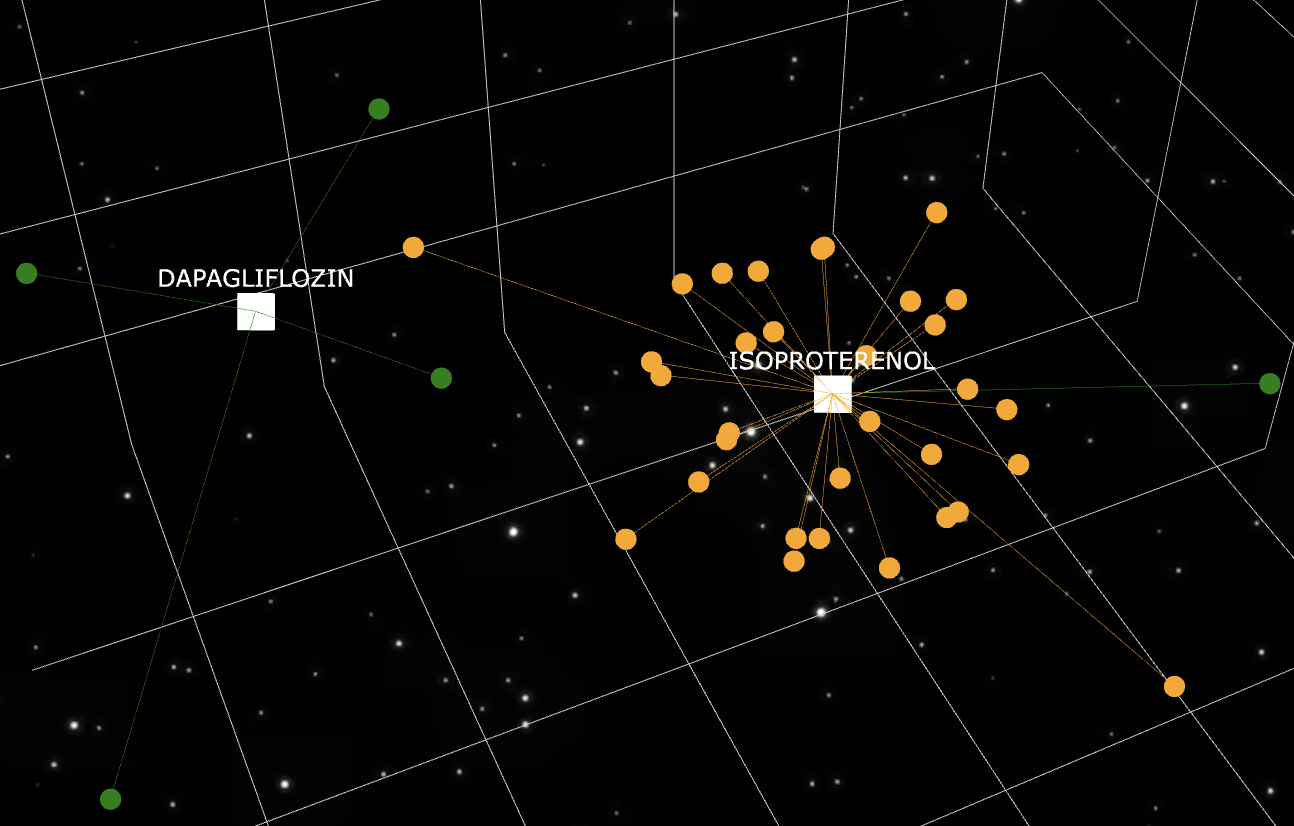
Select compound(s) and a max activity threshold to include in a 3D or 2D network. Shorter edges indicate stronger affinity.
Step 3 — Customize (optional)

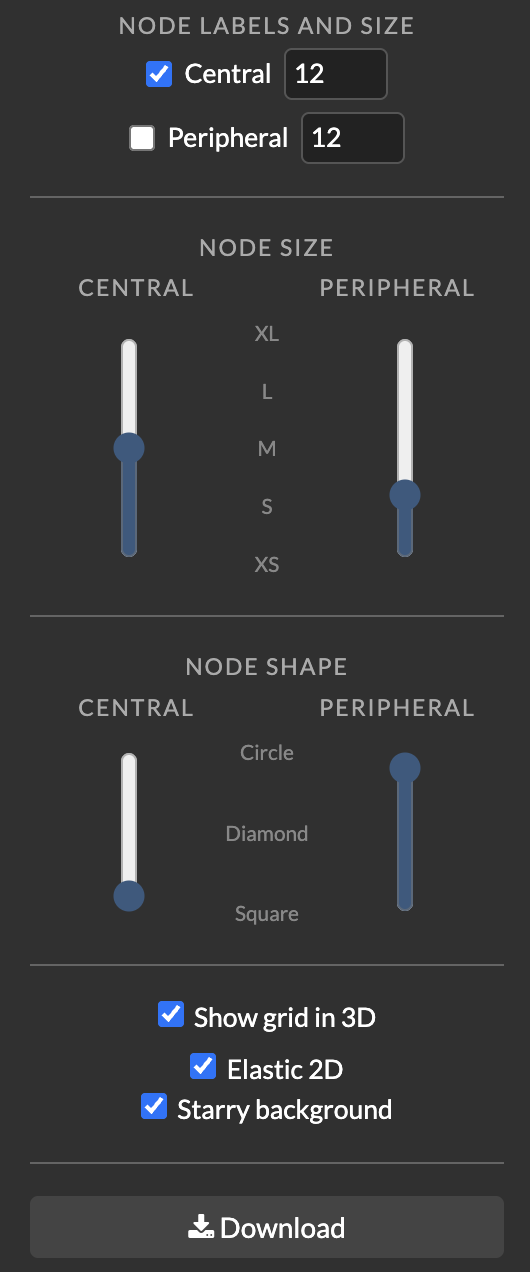
Tweak central and/or peripheral node labels, size, and shape. Add/remove the grid in the 3D figure. Add/remove elasticity in the 2D figure. Add/remove the starry background. Download the network.

Questions: paschalis.athan@gmail.com

Upload bioactivity data and explore compound–target networks in 3D and 2D.